Fatal Road Deaths – Map of The UK
Updated to 2018. In a interesting webpage from the BBC every road death on UK roads has been recorded by the Police so that anybody can search where they live or any particular location in the UK to establish how safe your road is.
How Safe Is The Area Where You Live?
See below which provides a link where you can type your post code and it will reveal all the crash reports recorded in your area.
To September 2017 the number of people killed on the roads amounted to 1,720. The 2018 figures are awaited. There has been a drop in deaths over the last 8 years but nevertheless the rate is still too high and every effort by the authorities has to be made to reduce the tragedies on UK roads.
In the year 2010, the Police is said to have recorded 1,850 deaths with 22,660 people seriously injured and 184,138 sustaining only minor injury.
Maria Eagle, the Labour Shadow Transport Secretary said that:
“These are real people’s lives destroyed. Parents losing children, children losing parents. This is avoidable and we have to focus on reduction.”
Road Accidents Crash Map
The interactive map has been provided by the Department of Transport and covers years 1999 – 2008. For more information on the data, how it was collected please see Crash: About the road accident fatalities.
The data collected can be searched by all or any of the following:

- Death by car accident
- Death to pedestrian
- Death motorbike
- Death cycle
- Death bus
- Death Goods Vehicle
- Other
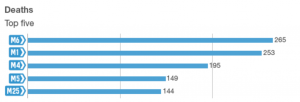
MOTORWAY CRASHES – MOST DANGEROUS
Motorways are statistically safer than A Roads, whilst driving at a faster speed, all traffic are traveling in the same direction but when a collision occurs there is often serious injury and death. The top five fatal accident black spots on our motorways are set out below.
Trunk Roads
Truck road or ‘A’ roads are statistically a lot more dangerous than motorways. The statistics speak for themselves when comparing deaths per mile. The A road are more diverse, have various hazards, most of the traffic are two ways, creating more of a head on collision.
The truck roads also pass through towns, villages, consist of dual carriageways and country roads.
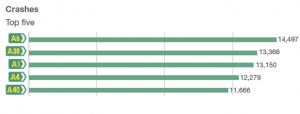
The most fatal car crashes however occur on the A215. This road is just 10 miles long, has had 2,800 plus crashes and 23 fatal car accidents.
According to Wikipedia it states:
The A215 is an A road in South London, starting at Elephant and Castle and finishing around Shirley. It runs through the London Boroughs of Lambeth, Southwark and Croydon.
The A215 was Britain’s most crash-prone A-road between 1999–2010, having had 2,836 crashes over its 10 mile length. [1]
Accident Map in the UK 2018
For the year 2018 there has been a delay by the Department for Transport due to data supply issues. However the following data is listed on their website for all recorded road accidents on UK roads including fatal car accidents.
The list of years are below from 2010 to 2018 (albeit delayed).
- 2018
- Publications 2017
- Publications 2016
- Publications 2015
- Publications 2014
- Publications 2013
- Publications 2012
- Publications 2010
- Data tables
Crash Statistics for 2017
In the report from the DfT the information supplied are summarised as follows:
- There were 1,720 fatal road deaths ending September 2017.
- The 2017 year is unremarkable to the previous year.
- A total of 27,101 people sustained serious injury or or were killed.
- A total of over 174,000 casualties.
- The volume of motor traffic levels increased by 1%.
- The total number of pedestrian injuries increased by 4$.
- There are over 24,000 pedestrian injuries.
- Over 6,000 pedestrians were involved in a fatal road crash or serious injury.
The conclusions for 2017 was that there was a significant decrease in the number of personal injuries across the board.
The DfT say that although the number of people that were killed in road traffic accidents has decreased, it appears that this is only a ‘natural variation.’
Local Interactive Fatal Car Crash Report
Provided by the BBC website with data from the Department for Transport, an interactive website has been developed so you can easily assess the number of tragic fatal accidents close to where you live. All you need to do is click on the link below:

How to find how safe the roads are where you live:
- Click on the above map.
- Enter your local Authority.
- You will then be able to see all the road deaths represented by dots on the map.
- On the right hand side, the default search is ‘All; but you can also search by car, bike, pedestrian.
Some more statistics from the data
- From the Map that statistics make chilling reading as it says that for 11 years between 1999 – 2010 there have been over 36,000 people killed on Britain’s roads.
- Cyclists Killed on the roads 1,575.
- Dangerous driving, it is claimed that one in every two fatal accidents where there has been a death by dangerous driving charge has a criminal record.
- ‘White Van Man’ and truckers are top of the list for offences.
- Bikers account for 1% of road traffic accidents but account for 21% of fatal accident claims.
- There were 8,424 pedestrians killed, majority during rush hour.
But what about the A537?
Reporting in the Mail Online, Britain’s most dangerous road is the A537 in the North West, a place called Maccesfield, Cheshire. The data has been complied by the Charity, Road Safety Foundation and EuroRAP
It claims that there were 44 fatal or serious car crashes in a period of just four years (that is between 2007-2011).
This was followed by A5012 which is between the A515 and the A6 in the East Midlands where there the statistics have raised from 18 to 25 fatal accidents or life changing serious injuries.